ملف:Milankovitch Variations sv.png
Milankovitch_Variations_sv.png (479 × 363 بكسل حجم الملف: 25 كيلوبايت، نوع MIME: image/png)
هذا الملف من ويكيميديا كومنز ويمكن استخدامه بواسطة المشاريع الأخرى. الوصف على صفحة وصف الملف هناك معروض بالأسفل.
This is a Swedish translation of Milankovitch Variations.png [1].
Description at the english version:
ملخص
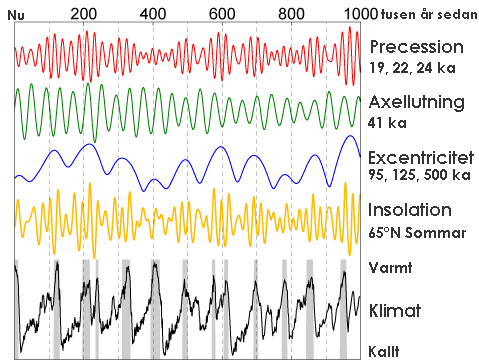
This figure shows the variations in Earth's orbit, the resulting changes in solar energy flux at high latitude, and the observed glacial cycles.
According to Milankovitch Theory, the precession of the equinoxes, variations in the tilt of the Earth's axis (obliquity) and changes in the eccentricity of the Earth's orbit are responsible for causing the observed 100 kyr cycle in ice ages by varying the amount of sunlight received by the Earth at different times and locations, particularly high northern latitude summer. These changes in the Earth's orbit are the predictable consequence of interactions between the Earth, its moon, and the other planets.
The orbital data shown is from Quinn et al. (1991). Principal frequencies for each of the three kinds of variations are labeled. The solar forcing curve (aka "insolation") is derived from July 1st sunlight at 65 °N latitude according to Jonathan Levine's insolation calculator [2] نسخة مؤرشفة في Wayback Machine. The glacial data is from Lisiecki and Raymo (2005) and gray bars indicate interglacial periods, defined here as deviations in the 5 kyr average of at least 0.8 standard deviations above the mean.
Copyright
This image was produced by Robert A. Rohde from publicly available data, and is incorporated into the Global Warming Art project.

|
يسمح نسخ وتوزيع و/أو تعديل هذه الوثيقة تحت شروط رخصة جنو للوثائق الحرة، الإصدار 1.2 أو أي إصدار لاحق تنشره مؤسسة البرمجيات الحرة؛ دون أقسام ثابتة ودون نصوص أغلفة أمامية ودون نصوص أغلفة خلفية. نسخة من الرخصة تم تضمينها في القسم المسمى GNU Free Documentation License.http://www.gnu.org/copyleft/fdl.htmlGFDLGNU Free Documentation Licensetruetrue |
| هذا الملفُّ مُرخَّص بموجب رخصة المشاع الإبداعي نسبة المُصنَّف إِلى مُؤَلِّفه - المشاركة بالمثل 3.0 العامة | ||
| ||
| تمت إضافة علامة الترخيص لهذا الملف كجزء من رخصة جنو للوثائق الحرة تحديث الترخيص.http://creativecommons.org/licenses/by-sa/3.0/CC BY-SA 3.0Creative Commons Attribution-Share Alike 3.0truetrue |
References
- Lisiecki, L. E., and M. E. Raymo (2005), A Pliocene-Pleistocene stack of 57 globally distributed benthic d18O records, Paleoceanography 20, PA1003, doi:10.1029/2004PA001071.[3][وصلة مكسورة]
- Quinn, T.R. et al. "A Three Million Year Integration of the Earth's Orbit." The Astronomical Journal 101 pp. 2287-2305 (June 1991).
الشروحات
العناصر المصورة في هذا الملف
يُصوِّر
image/png
تاريخ الملف
اضغط على زمن/تاريخ لرؤية الملف كما بدا في هذا الزمن.
| زمن/تاريخ | صورة مصغرة | الأبعاد | مستخدم | تعليق | |
|---|---|---|---|---|---|
| حالي | 17:29، 14 ديسمبر 2006 |  | 479 × 363 (25 كيلوبايت) | wikimediacommons>Shinzon | This is a Swedish translation of Milankovitch Variations.png [http://en.wikipedia.org/wiki/Image:Milankovitch_Variations.png]. Discription at the english version: == Description == This figure shows the variations in Earth's orbit, the resulting chan |
استخدام الملف
الصفحة التالية تستخدم هذا الملف:


